Open source software has gained traction over the past several years as businesses look for technical solutions that they can customize to their business needs. In the realm of network visibility and protection, open source network monitoring tools are great solutions for users who manage complicated, sprawling networks and want a better handle on how users, devices, and other network components are operating. Read on to learn about some of the top open source network monitoring solutions on the market and what you should consider when making your selection.
Also read: Best Data Analytics Tools & Software 2021
Open Source Network Monitoring Solutions to Consider
- What is Open Source Network Monitoring?
- What are the Features of Network Monitoring Tools?
- Top Open Source Network Monitoring Tools
- Benefits of Open Source Network Monitoring Tools
What is Open Source Network Monitoring?
Network monitoring is a type of software that focuses on tracking and alerting administrators to the overall health and performance of a network. This type of tracking can look more closely at user behaviors and security, or it can look at the age, quality, and performance of different network components. Network monitoring is used to assess and respond to the performance of network hardware, software, and users.
Network monitoring software comes in both open source and closed source formats. Closed source network monitoring tools are prepackaged by their vendor; they may offer some level of customization, but most changes that users can make are very templated or require external integrations to work. Open source network monitoring tools are designed to give network users more freedom when setting up their solutions. This often free, open source code approach gives network engineers the opportunity to modify and manipulate the monitoring source code to fit their organization’s exact needs.
Other approaches to network optimization: Best Network Testing Tools for Speed & Performance 2021
What are the Features of Network Monitoring Tools?
The best network monitoring tools help network administrators manage their resources with the following features:
- Packet capturing and data analysis: Network monitoring isn’t possible without networking data. Packet capture is the feature that collects data from different networking components, whereas data analysis is what actually makes sense of that data.
- Network polling: Think of network polling features as pulse checks. They regularly send out polls, which can be signals or tests, to determine the working order of different networking devices.
- Alerting system: Real-time, automated alerts are a key component of network monitoring tools. Alerts can notify network administrators, either within the tool or in a third-party messaging app, if a new problem, update, or other change to the network has been detected.
- Data visualization and graphs: Not every stakeholder in a network is a networking expert. Data visualization and graphs make it possible for all kinds of users to understand the most important networking metrics.
- Event logging and data storage: Network monitoring often relies not just on the momentary issues or changes, but on historical data that supports troubleshooting efforts. Event logging and data storage are important when network teams need to review past and current performance simultaneously.
- Reporting: After an issue or update has been addressed on the network, network administrators often have to report these changes outside of the networking team. Most network monitoring tools offer third-party integrations to share custom report data, and some tools even offer native reporting features.
Get more out of your data visualizations: Top Network Diagram Software & Tools 2021
Top Open Source Network Monitoring Tools
Nagios Core
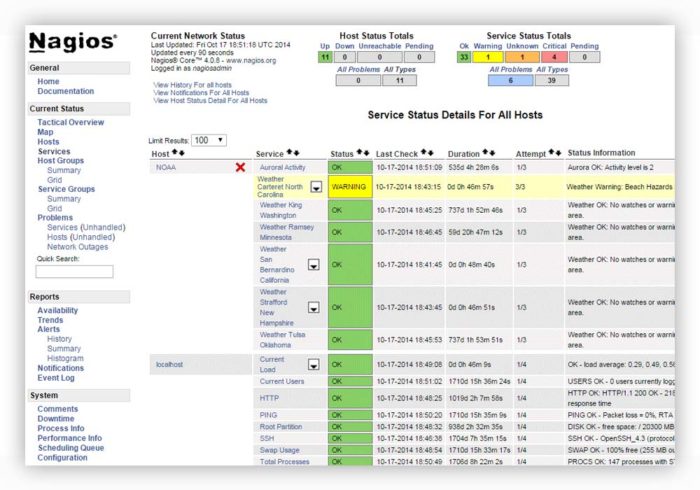
Nagios Core is one of the top network monitoring tools on the market with one of the deepest pools of customers. The popularity of this tool has led to many updates over time, with one of the most notable being a constantly growing plugin library for third-party integrations.
Unlike most solutions on this list, Nagios goes beyond the basics of support and documentation with an education plan for its users. Interested customers can complete one of two Nagios certified professional certifications, which not only provides additional learning to networking administrators, but also helps other leadership to verify that their networking team knows how to operate Nagios correctly.
Nagios also goes beyond the basics in their free plan for customers who need more. If you’re interested in a slightly more advanced router monitoring tool from Nagios, Nagios XI is a paid Nagios plan with more features for infrastructure monitoring.
Features:
- Email and SMS delivery available for alerts and escalation communications
- Automatic restart for applications, servers, devices, and services on the network
- Upgrade planning through trending and capacity planning extensions
- Multi-user access and user-specific views
- Availability reports and historical reports
Pro: Nagios offers one of the largest plugin libraries, with 10,000+ integrations available.
Con: Some users have trouble with initial configuration because Nagios relies on command and configuration files rather than more common approaches like a GUI interface.
Zabbix
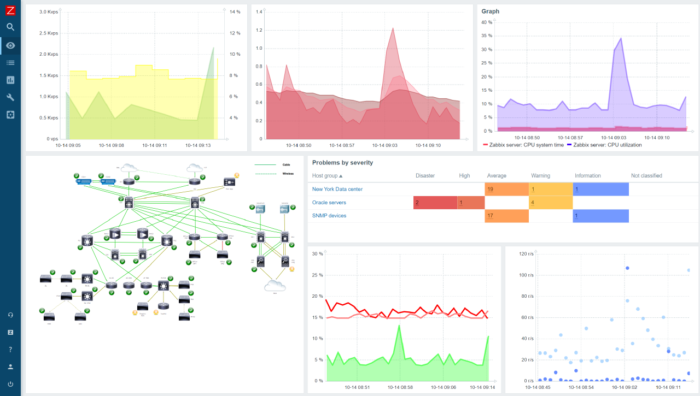
Zabbix is an open source monitoring tool that offers a surprising number of preexisting templates for network and device configuration, making it one of the simpler open source monitoring tools to initially set up. The tool offers focused features for metric collection and problem detection, but also emphasizes security with monitoring traffic encryption and customizable user permissions.
Zabbix also offers a wide range of data visualization options such as traditional graphs, network topology maps, network geomaps, and problem timelines. The variety of globally relevant visualizations makes Zabbix a strong choice for larger global enterprises and other companies with distributed networking infrastructure.
Features:
- Autodiscovery for network devices and device configuration changes
- Problem detection with logical expressions, false-positive avoidance, and defined multi-level dependencies
- Customized alerting and messaging available for email, SMS, Jabber, custom scripts, or messenger
- Traffic encryption, LDAP authentication, and user permission settings
- Out-of-the-box device configuration templates
Pro: Zabbix offers customizable user groups, views, and notifications through multi-tenant architecture.
Con: Zabbix offers limited official support and some users have concerns about the limited and disorganized approach to documentation.
Icinga
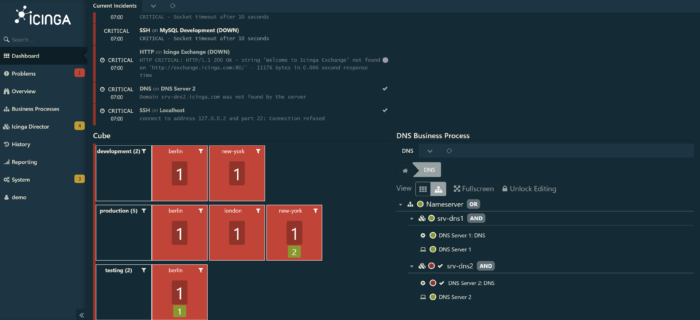
Icinga‘s open source monitoring software takes the stack approach, offering six core subcategories of monitoring strength: infrastructure monitoring, monitoring automation, cloud monitoring, metrics and logs, analytics, and notifications. The stack strategy helps Icinga’s customers to get a more holistic view of their networking performance, but also makes it possible to break down networking visibility into more granular channels.
Icinga works hard to create a user-friendly experience, not only with an accessible and user-friendly interface, but also with these teamwork management features: flexible contact importing, infrastructure-based team assignments, and customizable batch notifications.
Features:
- Color-coded network status visualizations
- Root cause analysis and determination through defined entry points
- DevOps tool compatibility
- Scalable native clustering feature
- Element grouping and filtering for custom views
Pro: Icinga is one of the more accessible tools in this market, with colorblind design themes, ARIA screen reader descriptions, and support for nine languages.
Con: Although it is possible to integrate with third-party tools, Icinga does not natively offer some of the graphing and data visualization found in other solutions.
OpenNMS
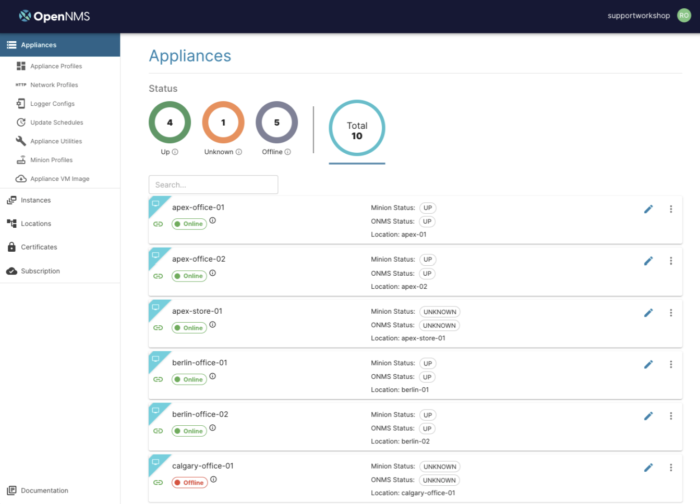
OpenNMS has one of the strongest user experience (UX) and digital experience monitoring emphases in the open source network monitoring market. The biggest asset in this area is the Minion Virtual Appliance, which is a built-in virtual device for distributed monitoring and data collection. Some of the top value-adds from Minion include centralized inventory management for log data and statistics, automatically scheduled software updates, simple portal-driven orchestration and configuration, and customizable policies for deployment.
The OpenNMS umbrella offers two different product tiers to customers. OpenNMS Horizon is the more traditional free, open source option with frequent community-driven updates. OpenNMS Meridian is a paid subscription plan that offers customers a stable version of OpenNMS to work with.
Features:
- Digital experience monitoring with Minion infrastructure
- XML scripting and webUI for systems configuration needs
- Notification integrations with E-mail, Slack, Mattermost, and custom scripts
- Streamlined metadata and storage management
- Data processing scalability for flows, SNMP traps, syslog messages, and streaming telemetry
Pro: The Minion Virtual Appliance is a unique feature that allows the tool to collect data from devices and services that are typically harder to locate or access.
Con: Some users have experienced a lag in alerting and reports.
Prometheus

Prometheus is an open source network monitoring solution that was modeled after Google’s Borgmon, a time-series database and query tool that remains internal to Google teams. The time-series approach and emphasis on varied data storage solutions make Prometheus the ideal open source option for containerized networks that need additional visibility across their infrastructure.
Prometheus is available under the Apache 2 License on GitHub. It is also a Cloud Native Computing Foundation graduated project, making it a good choice for cloud or hybrid networking environments.
Features:
- PromQL is available for queries that process time-series data into a variety of graphs
- Data visualization through built-in expression browser, Grafana integration, or console template language
- Functional sharding and federation for scalable storage needs
- Alertmanager for notifications and silencing
- Client libraries for instrumentation of services
Pro: Prometheus was custom-designed for containerized networks, making it especially suited for organizations that work with Kubernetes and other container solutions.
Con: Prometheus is limited on certain data management features, like data storage and log management.
Graphite
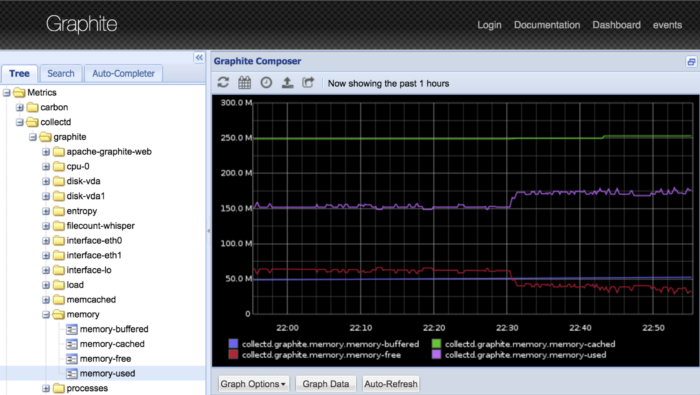
Graphite is a tool that is more frequently used by medium-sized enterprises because it is highly accessible and focused on a more skeletal monitoring infrastructure. The main offerings in this solution are numeric time-series data storage and on-demand graph creation from this data. Although Graphite is limited in some areas like dashboarding and reporting, the tool offers data integrations with several third-party tools, including Nagios Core.
Features:
- Numeric time-series data storing and on-demand graphing
- Custom imagery through raw images, CSV, XML, and JSON output styles and formats
- Built on the Django web framework with the ExtJS javascript GUI toolkit
- Cairo graphics library for graph development
- Documentation and user community in GitHub
Pro: The simple infrastructure focuses solely on received data points, stored data points, and present data, so some users find this tool has a smaller learning curve than its competitors.
Con: Some users have experienced problems with their firewalls while using Graphite, specifically when outbound traffic is restricted.
Checkmk
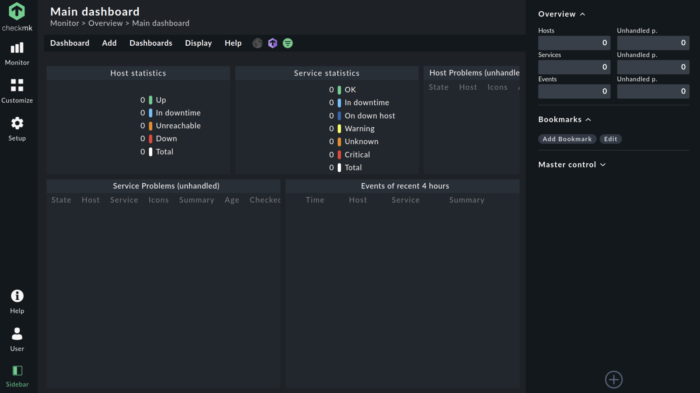
Checkmk is an open source solution that relies heavily on automation features, with auto-detection and configuration across a variety of networking and security components, as well as smart autodiscovery for data analytics your organization will find most relevant. This product emphasizes the wide variety of infrastructures that it can monitor, which includes servers, networks, applications, databases, clouds, containers, storage components, and the Internet of Things.
Checkmk Raw Edition is a free, open source solution that is compatible with several different platforms and operating systems. Checkmk Enterprise Edition offers added monitoring features at an additional cost, but users can try out this solution with their free trial period if interested.
Features:
- Rules-based configuration, instead of template-driven approach
- More than 1,800 preconfigured checks
- Switch port visibility and troubleshooting through the switch port statistics feature
- Bandwidth consumption monitoring at each port
- VPN and remote workplace monitoring features
Pro: Many users find the configuration process and troubleshooting to be more intuitive on this tool than with other open source competitors.
Con: Some users believe the documentation for Checkmk is lacking or outdated for current user needs.
Benefits of Open Source Network Monitoring Tools
Network visibility
Both open source and closed source network monitoring tools offer a key benefit to network infrastructure: network visibility. With network mapping, reporting and data visualization, and alerts for troubleshooting needs, network administrators now have a tool that automates, or at least supports, their abilities to see what’s happening and most urgent on the network.
Customizability
Open source network monitoring tools come with open source code, meaning that programmers who understand how to work with the language(s) that are compatible with that tool can manipulate it to meet their needs. Particularly for organizations that are working with hybrid or especially niche network designs, open source network monitoring gives them the chance to customize the tool so that it tracks the right data.
Integrations
Because open source tools are so malleable, many tools in this market are also vendor-neutral when it comes to third-party integrations. Some open source monitoring tools have prebuilt templates or APIs for specific third-party resources, but even if that’s not the case, it’s often possible to custom-code the platform to integrate with your chosen external networking solutions.
User community
Open source software solutions typically have active user communities, and open source network monitoring is no different. Whether it’s on GitHub or the tool’s own site, look for user community forums and extensive documentation to support your team when they’re learning how to use an open source tool.
Security updates
Open source network monitoring tools are changing their base offerings frequently, particularly in response to requests and concerns from the user community. Many of these updates are patches for security vulnerabilities; this consistent visibility and response to security concerns mean that open source tools are often some of the most secure on the market.
Cost
Although some open source solutions have paid plans or features, nearly all open source network monitoring tools offer robust features in their free versions. This not only leads to cost-savings for the enterprise, but also gives network engineers and other tech experts in your company more freedom to experiment with the tool without incurring additional costs.
Take a closer look at closed-source network monitoring alternatives here: Best Network Monitoring Tools & Software of 2021
The post Best Open Source Network Monitoring Tools 2021 appeared first on Enterprise Networking Planet.
